
Electrical Load Control and Consumption Monitoring
Delégo offers a powerful load control logic and comprehensive consumption monitoring across electrical energy, thermal heating/cooling, water and gas.
Electrical Load Control
Delégo offers a powerful load control logic, which operates by keeping under control one or more absorption values, and intervening with the disconnection of the utilities predisposed to exceed an alarm threshold, according to a precise priority set in advance by the installer and editable at will by the end user through the app. The user can also decide that for a certain time, a utility should not be disconnected if the threshold is exceeded; in this case it is sufficient to set it in manual mode, always through the app or an internet browser.
Access to Load Control Management
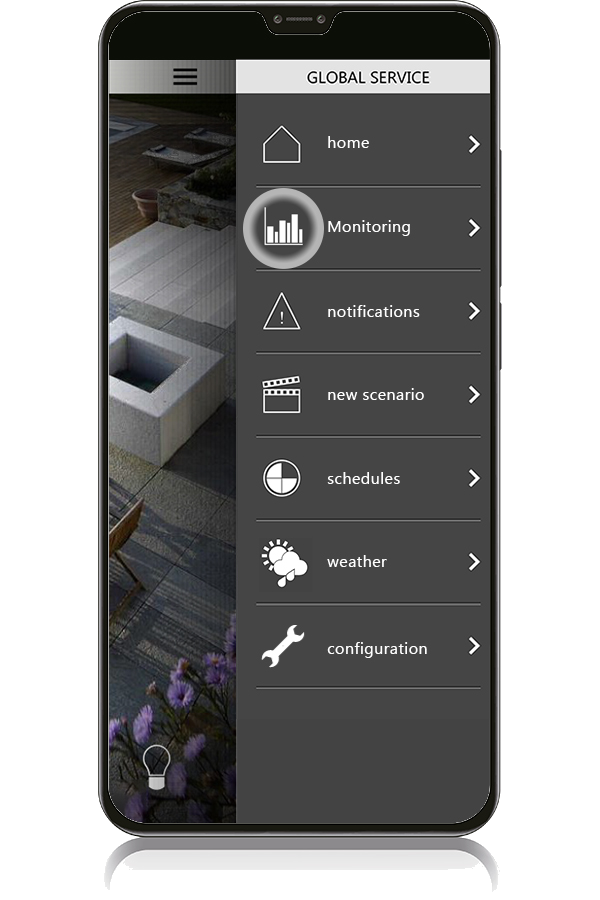
To access load control management with the app, open the Global Service context menu and select Load control.
Displaying Drawn Energy Flow
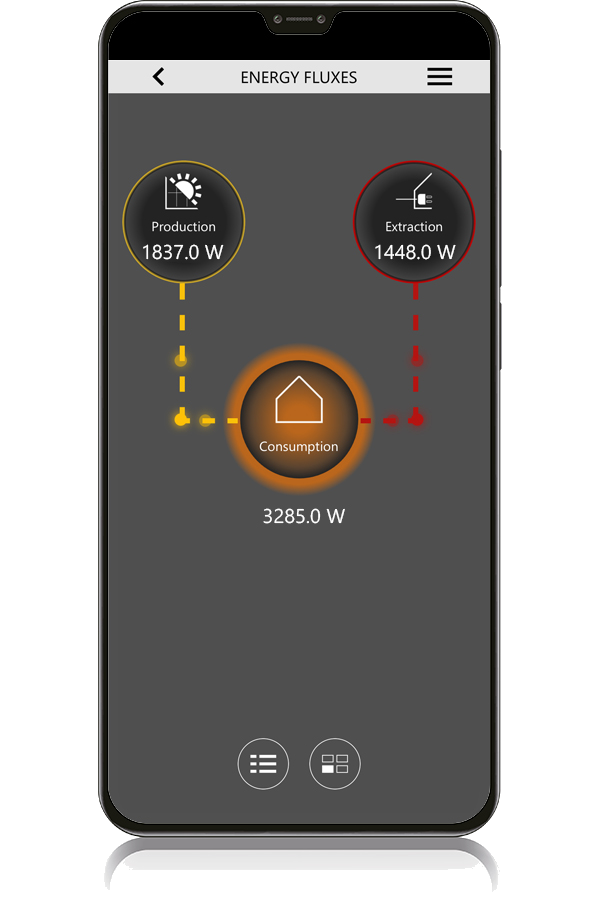
Displaying the flow of energy drawn. The instantaneous electrical power is acquired using one of the technologies made available by the Delégo server, with a KNX and/or Modbus (RS485 or TCP/IP) meter/analyser installed upstream of the loads.
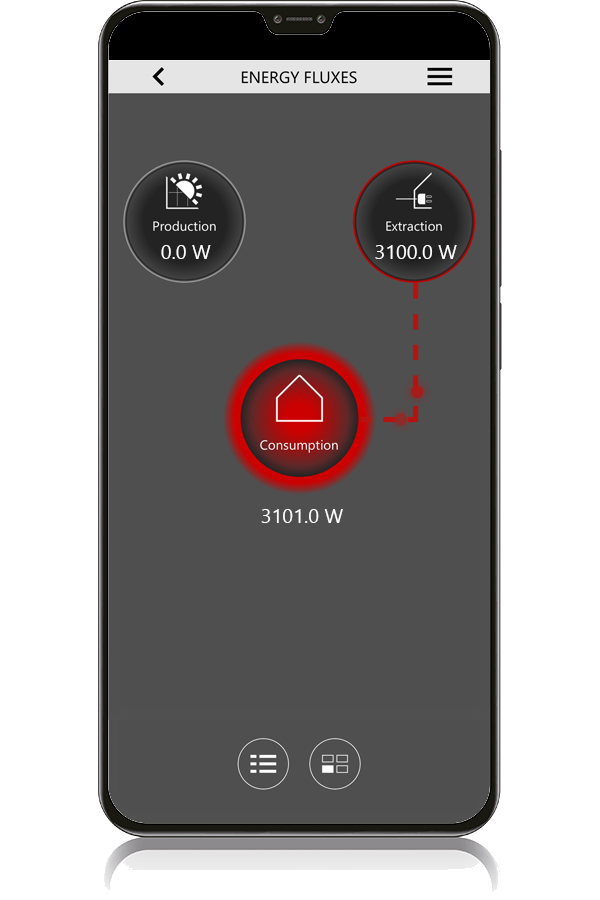
Produced, Withdrawn and Self-Consumed Energy Flows
Display of energy flows produced, withdrawn and self-consumed by the photovoltaic generator calculated automatically by the Delégo server. In the presence of a renewable source, it is sufficient to add a second meter downstream of the static generator.
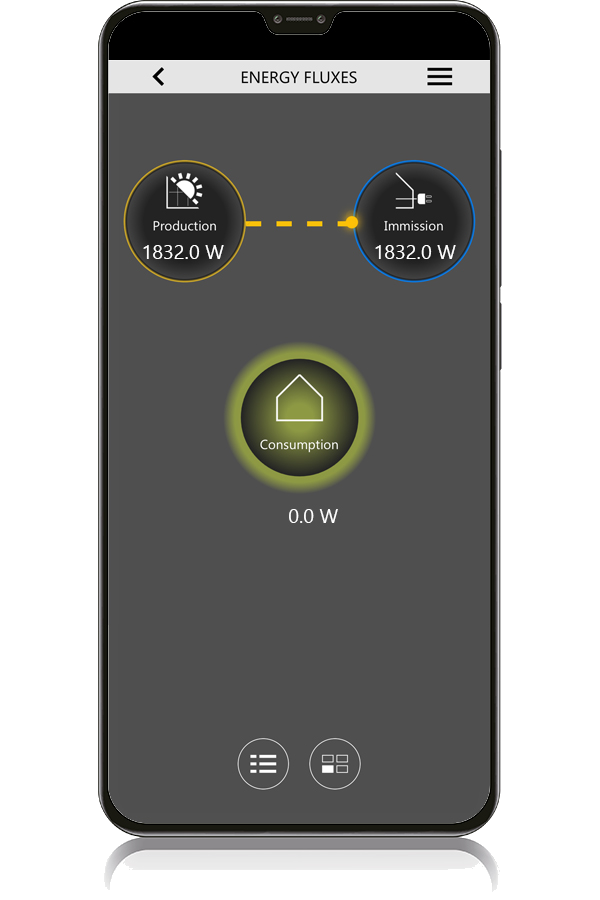
Display of Fed-in Energy Flow
Display of fed-in energy flow: in case of absence of electrical loads and availability of renewable energy, the electricity grid acts as a back-up for the available energy, which can be withdrawn later through on-site exchange.
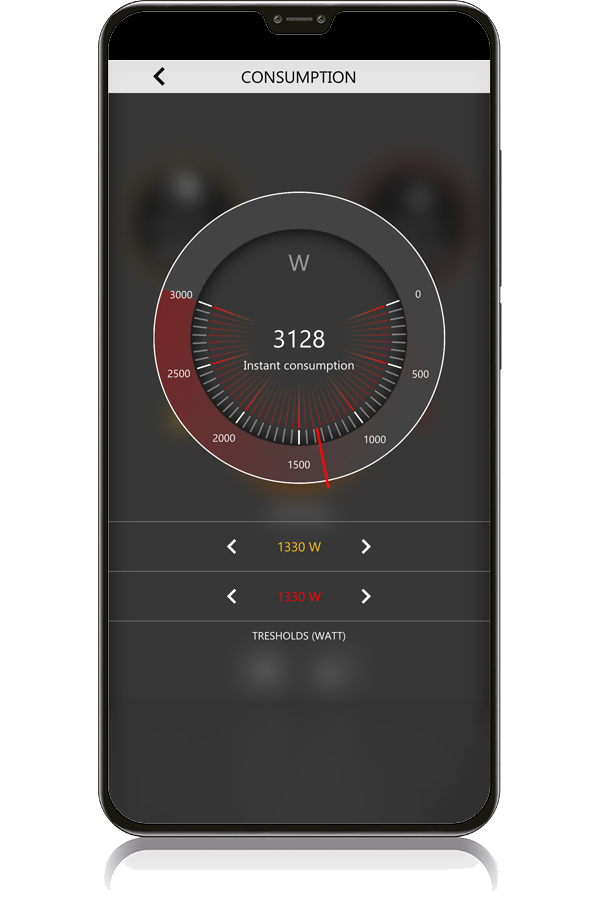
Instantaneous Power and Threshold Setting
It is possible to display the instantaneous electrical power withdrawal and set the intervention thresholds of the automatic load disconnection and reconnection algorithm. The loads themselves are intercepted by relay outputs controlled with KNX and/or Modbus technology.
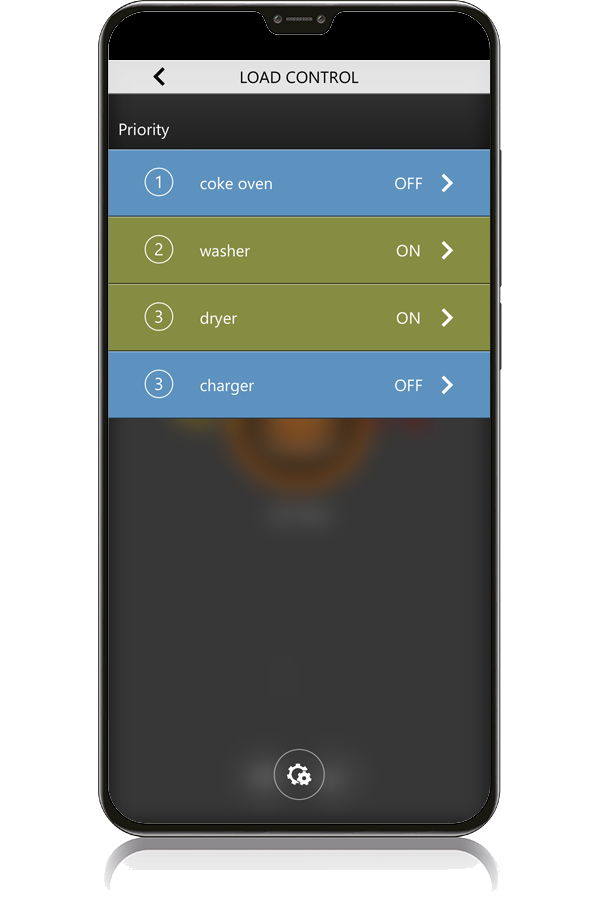
Complete List of Loads and Status Indication
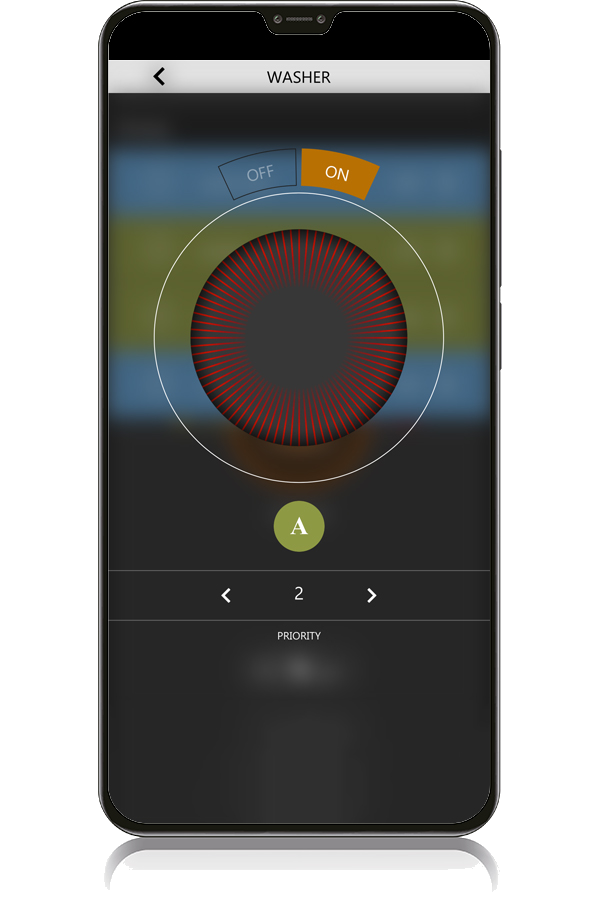
The user has a complete list of the loads at his disposal, indicating the manual (blue) and automatic (green) status, on/off switching status and priority level.
Priority Level Modification and Manual Mode
The user can change the priority level of the load and decide whether to enter it manually or automatically.
Cloud Energy Flows and Time Breakdown
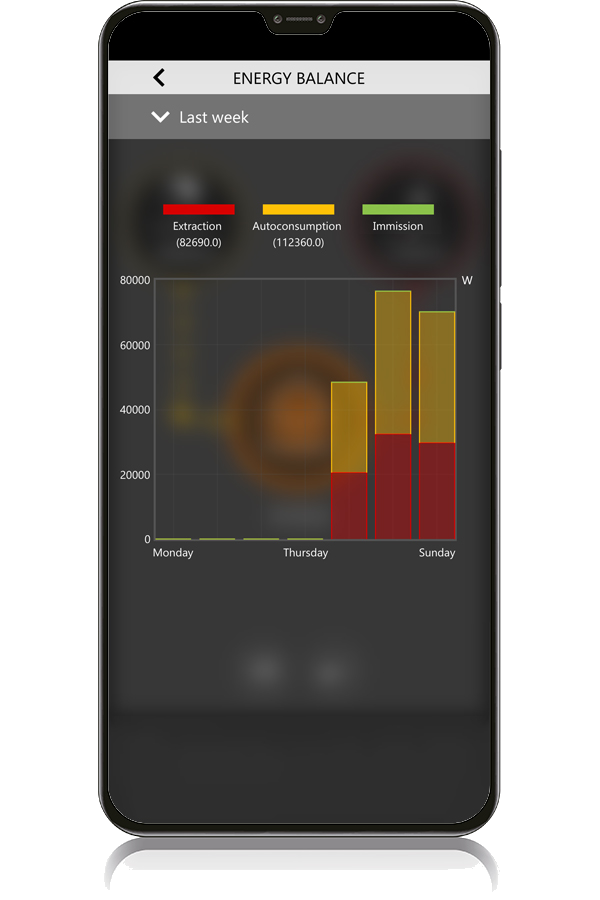
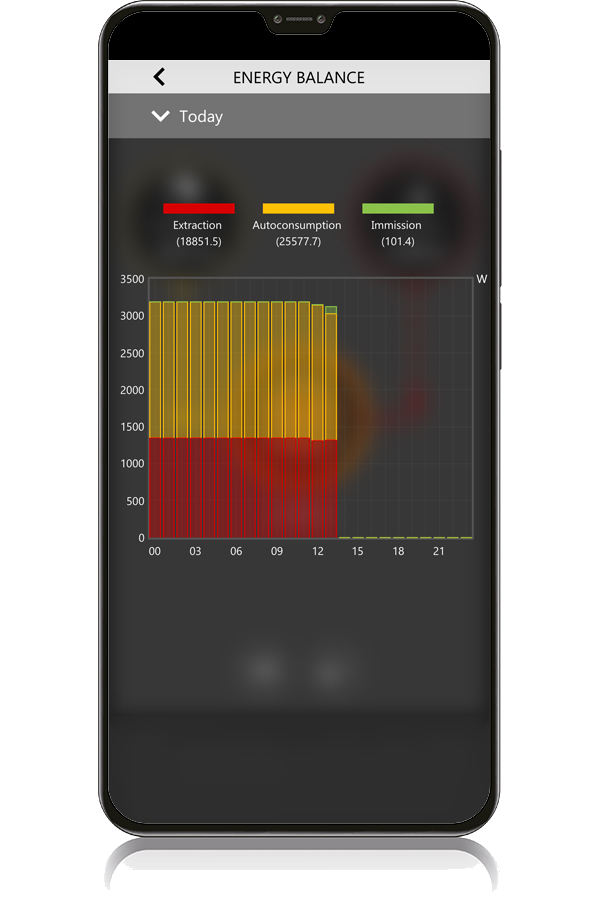
The energy flows stored on the cloud can be consulted graphically directly on the mobile device with daily, weekly, monthly and yearly aggregation and immediate breakdown between withdrawn, self-consumed and fed-in energy.
Graphical Breakdown and Trend Overview
The breakdown of consumption and production data over time provides visual curves and bar graphs that guide the user toward more efficient energy management.
Consumption Monitoring
Delégo allows to monitor the energy consumption and the possible electrical production of a photovoltaic panel system, through a dedicated management. Consumption can be measured through devices on different technology (e.g. KNX, Modbus, M-Bus on RS485). Regardless of the technology, the consumption and production data are displayed in a uniform way in the graphics of the visualisation, and historicized inside the server in order to offer a view of their trend over time, through graphs generated directly inside the server itself.
Access to Consumption Monitoring
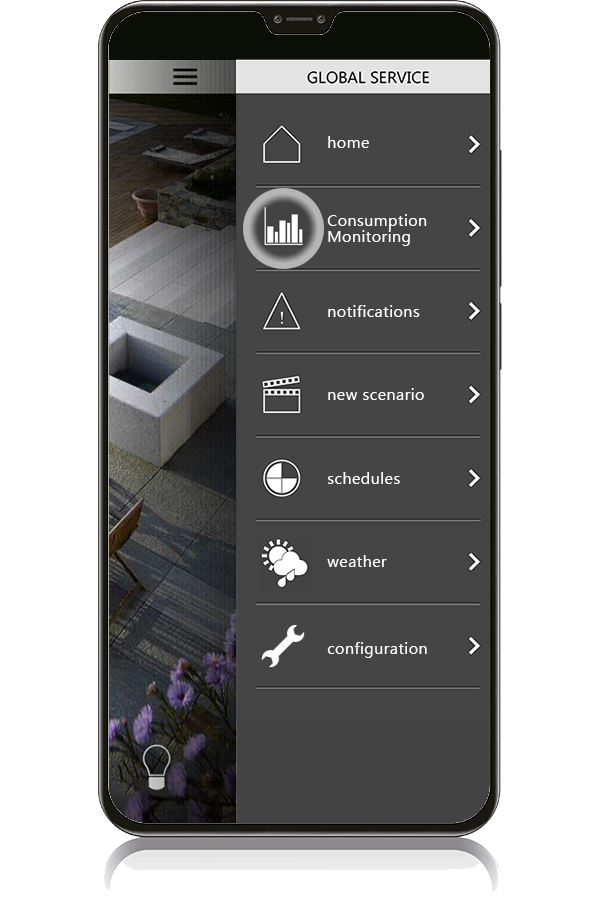
Access the Consumption Monitor from the Home page of the mobile app or PC, by opening the Services contextual menu located at the top right of the title bar and selecting Consumption Monitor.
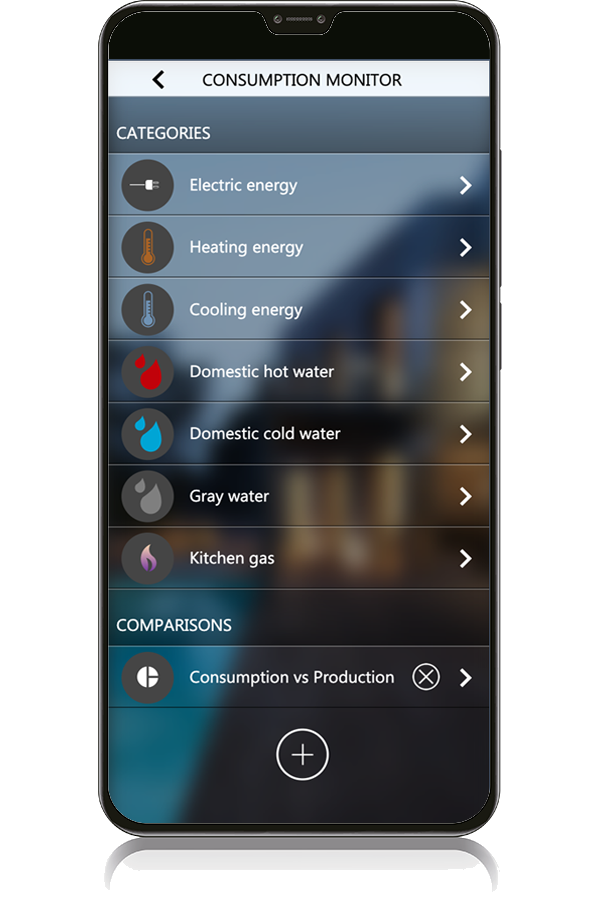
Enabled Consumption and Production Categories
You can access the list of all enabled consumption and production categories and manage: electrical energy (produced by a renewable source or absorbed from the grid), thermal energy for heating and cooling, volumes of hot/cold water for domestic use, volumes of grey water and volumes of gas for cooking.
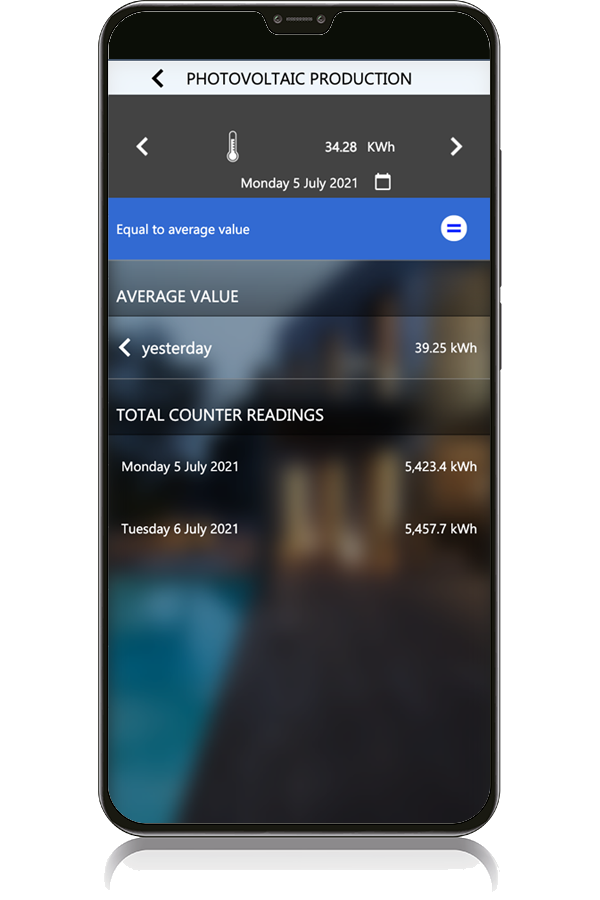
Meter Detail View and Numerical Summary
By selecting a measuring unit, you can access the detailed graphic page, which briefly displays the numerical data of interest such as the consumption or production for the current day, the average consumption or production value for the current season and the totalized values at the last reading of the installed meter.
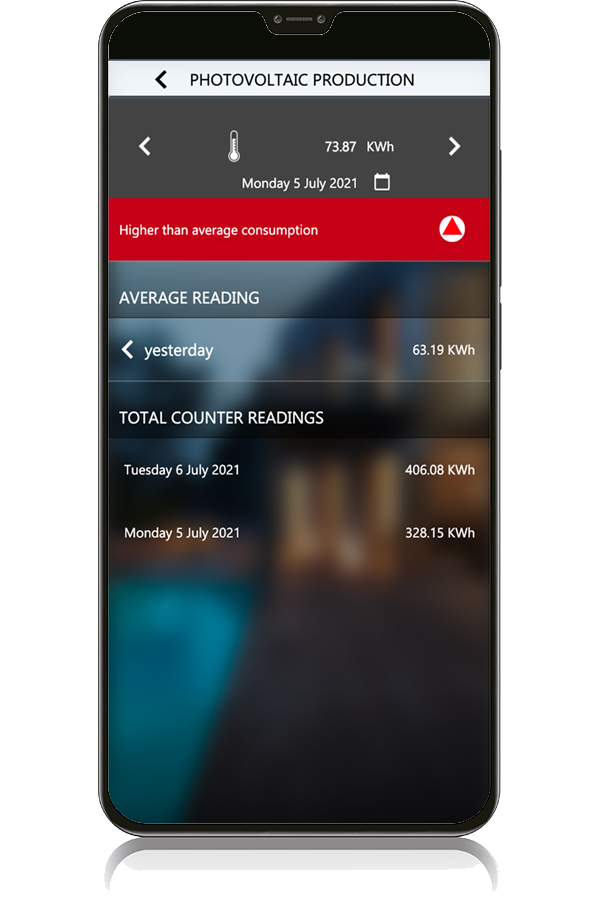
Above Seasonal Average Indicator (Red)
The red colored band in the detail page of the selected category is a qualitative indicator that allows the user to understand immediately the condition for which consumption on the selected day is higher than the average value for the reference season, stimulating a more conscious use of resources.
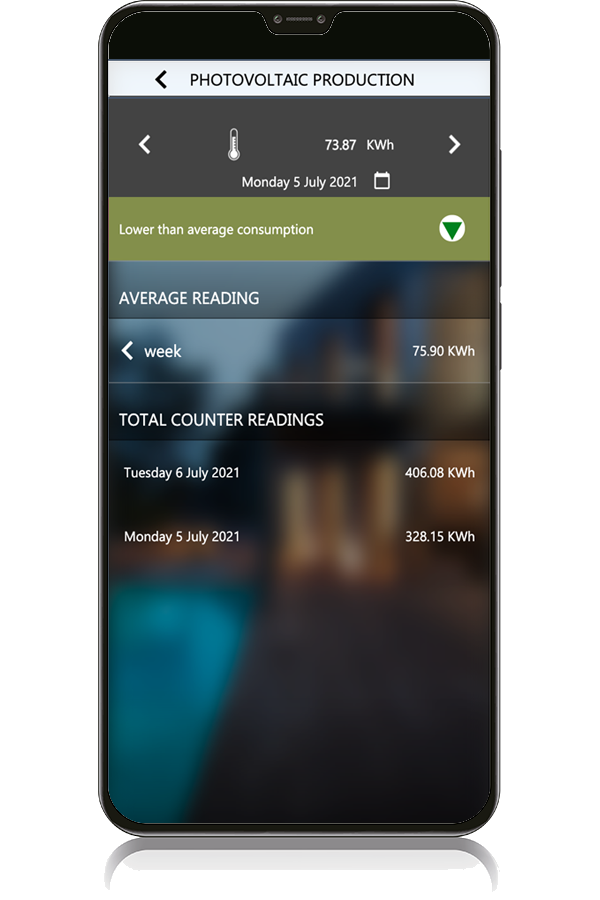
Below Seasonal Average Indicator (Green)
The green colored band in the detail page of the selected category is a qualitative indicator that allows the user to understand immediately the condition for which the consumption of the selected day is lower than the average value of the reference season.
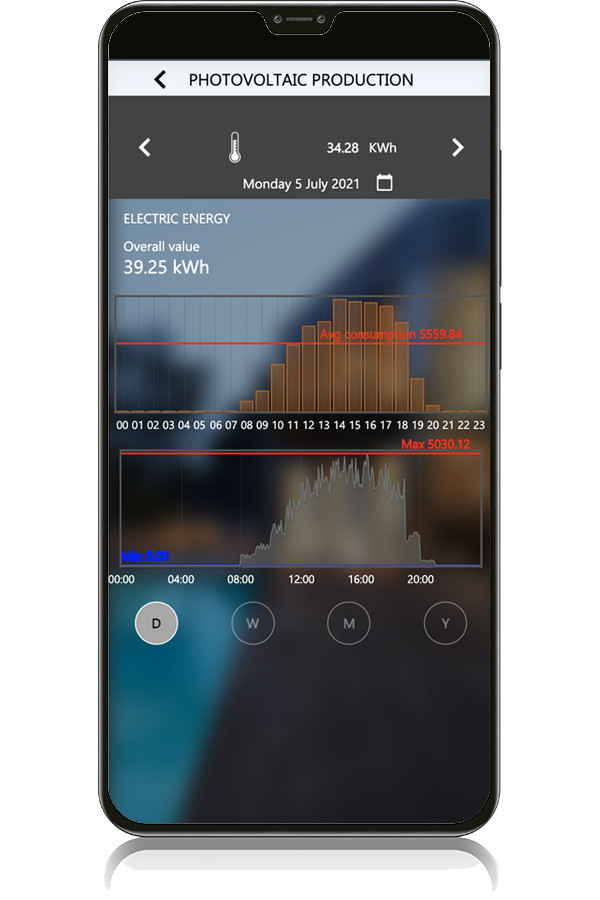
Cumulative Quantity and Instantaneous Power Trend
Scrolling down the graphic detail page of an enabled category, it is possible to view the graphic trend of the cumulative quantity (energy produced or consumed, volumes absorbed) and, if available, the trend of the instantaneous power (electrical or thermal power, produced or consumed). Data can be viewed on a daily, weekly, monthly and yearly basis.
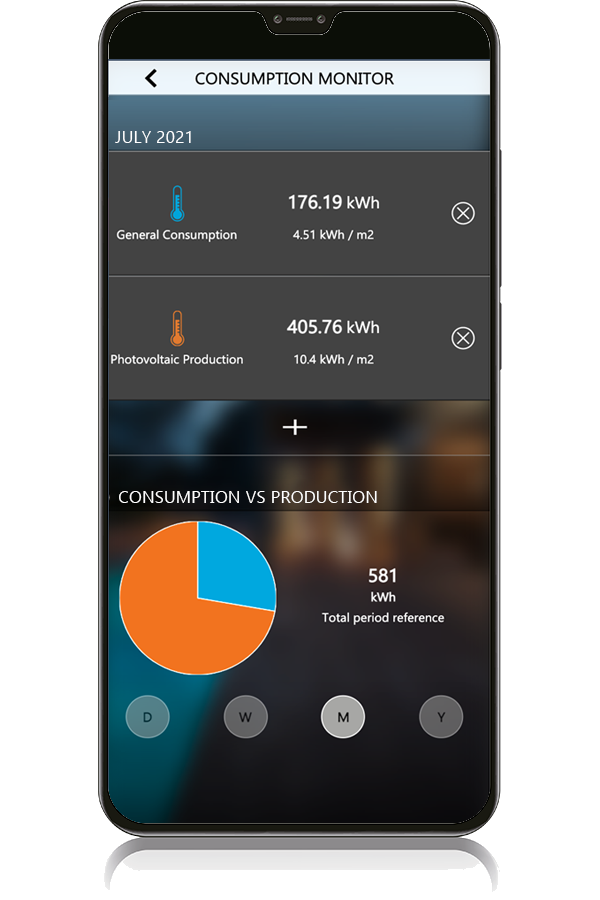
Periodic Comparison with Pie Charts
The data available can also be compared with each other by the user, directly on the app: the pie charts allow you to evaluate the contributions of each category compared to the total in different periods, on a daily, weekly, monthly and annual basis.
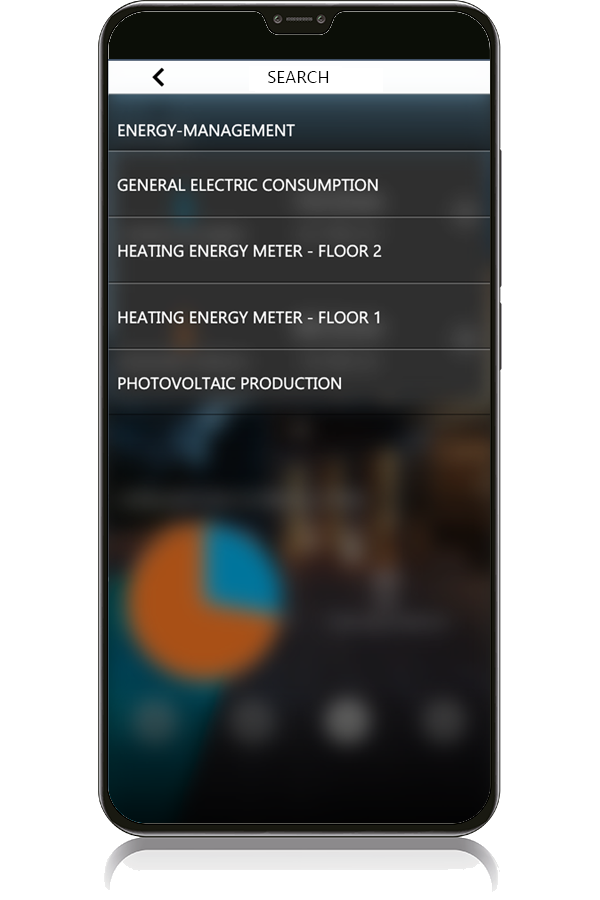
Create Custom Comparison Graphs
The pie comparison graphs can be created directly by the user by pressing the “+” button and selecting from the list the measuring unit installed in the plant with the data you want to consider for the comparison.